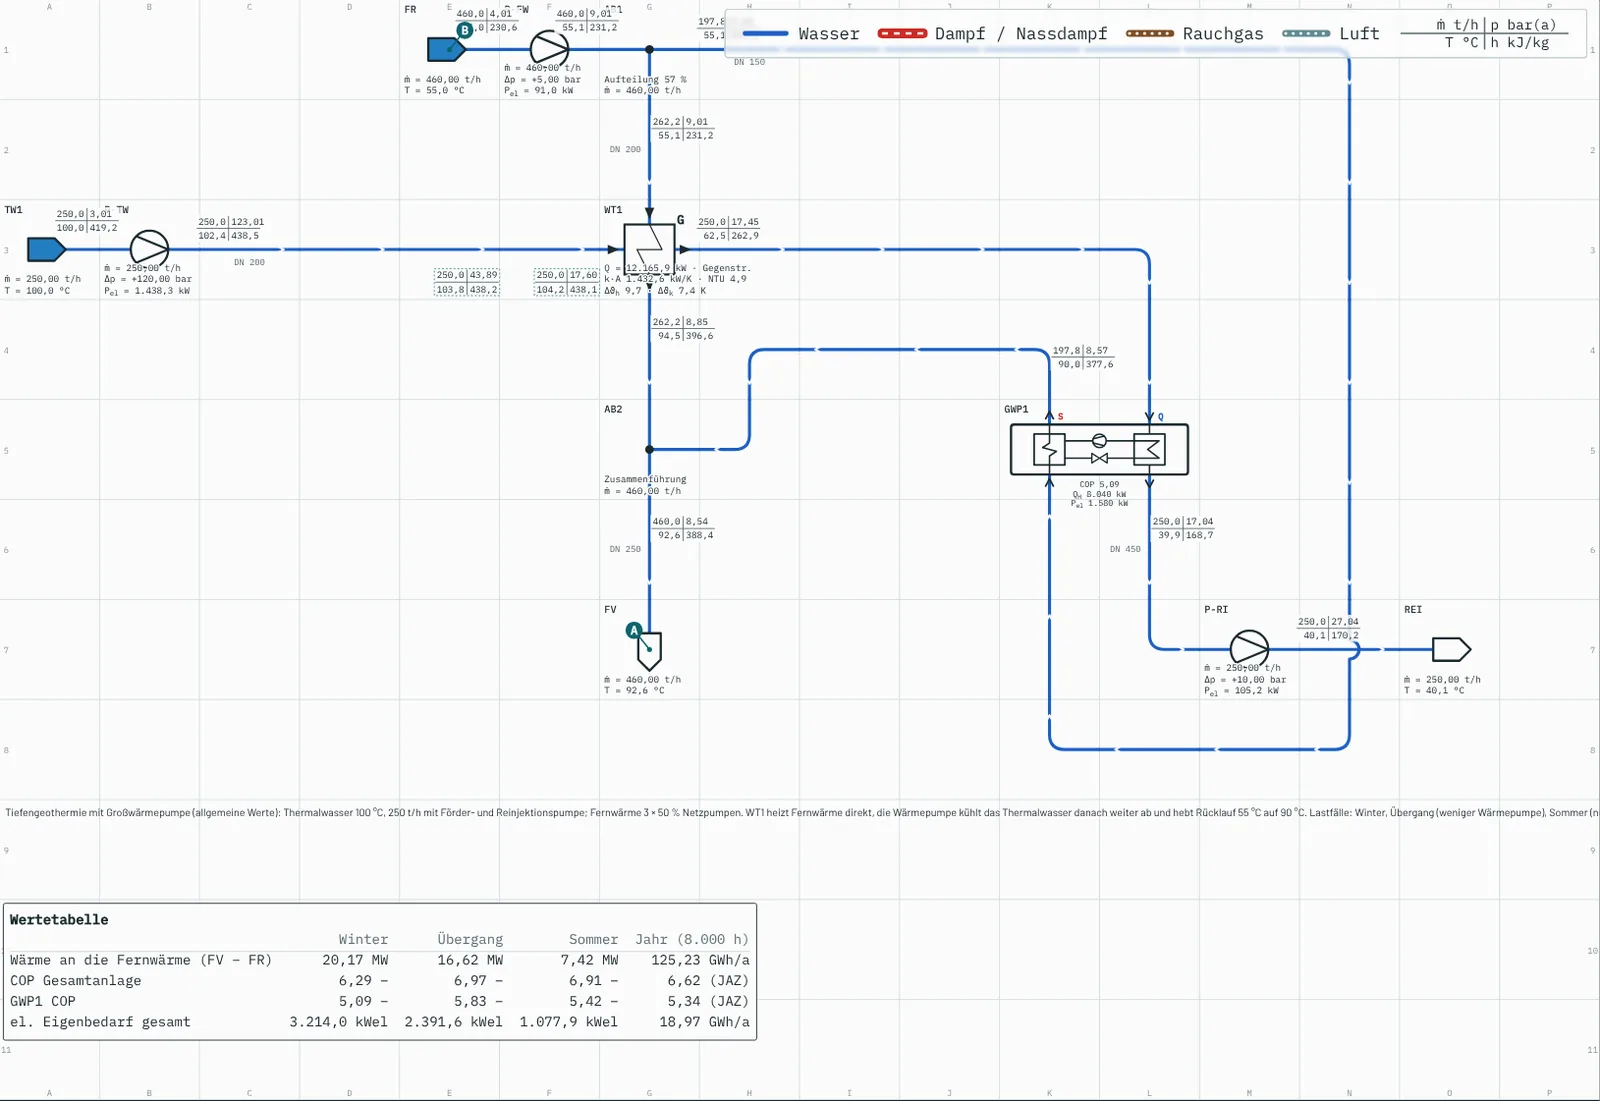
What happens in the plant
The brine comes out of the production well at 100 °C. The production pump lifts it over 1,100 m of height and 1,200 m of pipe; in winter it needs 1.4 MW of power for this. In heat exchanger WT1 the brine transfers its heat directly to a district heating side stream, which is heated from 55 °C to around 94 °C. After that, the brine is still about 62 °C – too cold for the network, but an excellent heat source.
This is where the large heat pump GWP1 comes in (refrigerant R1234ze(E), centrifugal compressor). Its evaporator cools the brine down to 40 °C, its condenser raises a second district heating side stream from 55 to 90 °C. The reinjection pump pushes the cooled water into the reinjection well. Network pumps (3 × 50 %) circulate the district heating water; a pipe tee splits it between heat exchanger and heat pump.
20.2 MWheat to the network in winter
+66 %more heat from the same production thanks to the heat pump
SPF 6.6seasonal performance factor of the whole plant including all pumps
Results per load case
| Load case | Production | Direct (WT1) | Heat pump | COP HP | Total power | Overall plant COP | Reinjection |
|---|
| Winter (3,000 h) | 250 t/h | 12.2 MW | 8.0 MW | 5.1 | 3.21 MW | 6.3 | 40 °C |
| Transition (3,000 h) | 250 t/h | 12.2 MW | 4.5 MW | 5.8 | 2.39 MW | 7.0 | 50 °C |
| Summer (2,000 h) | 120 t/h | 5.8 MW | 1.6 MW | 5.4 | 1.08 MW | 6.9 | 53 °C |
Over the year (8,000 h) the plant delivers 125 GWh of heat from 19 GWh of power: seasonal performance factor of the whole plant 6.6, of the heat pump alone 5.3. In winter the production pump needs almost as much power as the heat pump. More on this in the case study.
In the transition period the heat pump runs with less network water, the brine stays warmer and the COP even rises slightly. In summer production drops to 120 t/h and the heat pump only runs at low output.
How to use the example
- Click “Open in the tool” – the diagram opens as a project of its own.
- Switch the load case at the top (winter, transition, summer) and compare the values on the lines.
- Change production rate and temperature of the well at TW1, network temperature and flow at FR, the split at AB1 or the heat pump flow temperature – everything recalculates instantly.
- Print as a PDF with title block or save as a file.
What the example does not cover
Pressure maintenance in the brine circuit, water chemistry and scaling, well and reservoir behaviour, the network’s part-load map over the whole year, and costs. For the economics of a large heat pump, use the large heat pump calculator.
Frequently asked questions
Why a heat pump downstream of deep geothermal?
Via a heat exchanger, the brine can only be cooled to just above the district heating return, in the example to around 62 °C. The heat pump cools it further to 40 °C and lifts this heat to flow temperature. This gives around 66 % more heat from the same production in winter.
What COP does the heat pump reach here?
Around 5 to 5.7, depending on the load case. At 62 to 40 °C the source is very warm, so the temperature lift to the 90 °C flow is small. With river water as the source, the COP would be more like 2.5 to 3.
Are these values from a real project?
No. The example uses general, typical values for deep geothermal energy in southern Germany (brine around 100 °C) and a 90/55 °C district heating network. For a real project you enter production rate, temperatures and network data yourself.
What does the tool cost?
Nothing. The heat balance tool can be used without sign-up; students with a university e-mail address use all features free of charge.
← All heat balance examples · Free calculators